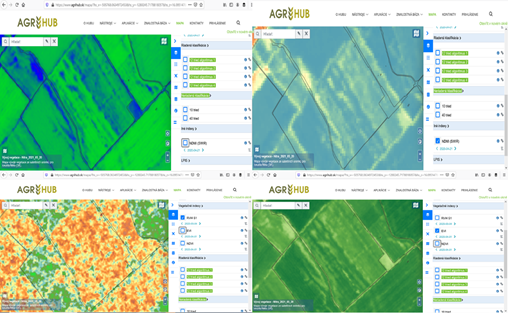
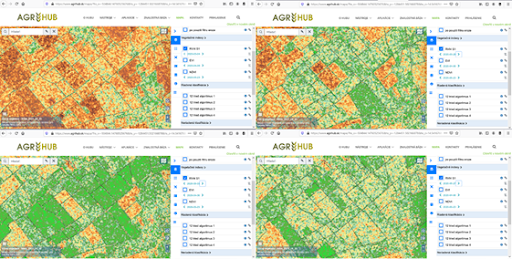
The focus of this challenge will be on usage of time series of Sentinel 2 and Sentinel 1 data to detect temporal and spatial variability of crops. Due to a short time, participants should focus mainly on winter wheat (other crops can be analyzed as well). The focus will be on selection of indexes, which correlate the best with content of nitrogen in crops during different phenological phases.

Figure 1: Using different S1 and S2 Indexes for Spatial variability Definition
This data will be used for definition of management zones for applying nitrogen during the season. This information will be combined with data from yield monitors, sampling of content of nitrogen in crops and soil sampling and further used for preparation of recommendation for applying of Nitrogen. This experiment will be tested on selected farms.
Second part of the analysis will be focused on the best timing of application of nitrogen. The timing will be defined on the base of analysis time series of selected indexes from satellite images and monitor the crop dynamism.

Figure 2: Time series from RVI Index of Sentinel 1 data from different phenological phases.
Data will be compared with samples from the content of Nitrogen in Crop and also with climatic data from IoT sensors. Focus will be on optimization of time for application of nitrogen. We will use historical data and then solution will be verified during the season 2022.
CHALLENGE GOAL: Crop status monitoring methods evaluation based on analysis of time series of Sentinel 1 and Sentinel 2, and other data (Crop rotation, IoT, Yield monitors, data about fertilization, soil and crop sampling data, data from N sensors, electric conductivity etc.). This data will be analyzed using methods of Earth Observation, Statistical AI and establishing advisory services with focus on time and space optimisation of fertilization (mainly by Nitrogen).
The registration for the challenges is open! Are you interested in extending current experiments available at Slovak Agrihub?
